
By the time a maize crop looks pale from the bakkie — or NDVI finally dips on the map — a nitrogen shortfall has usually been building for a week or two, and some yield is already gone. The useful question is whether a satellite can flag that stress while there is still time to act. For nutrient stress specifically, the answer increasingly sits not in NDVI, but in a narrow slice of the spectrum most people never look at: the red edge.
Why NDVI tells you late
NDVI — (NIR − Red) / (NIR + Red) — is the workhorse of crop remote sensing, and deservedly so. It tracks green canopy and biomass well, from free imagery, anywhere. But as an early warning for nutrient stress it has two weaknesses.
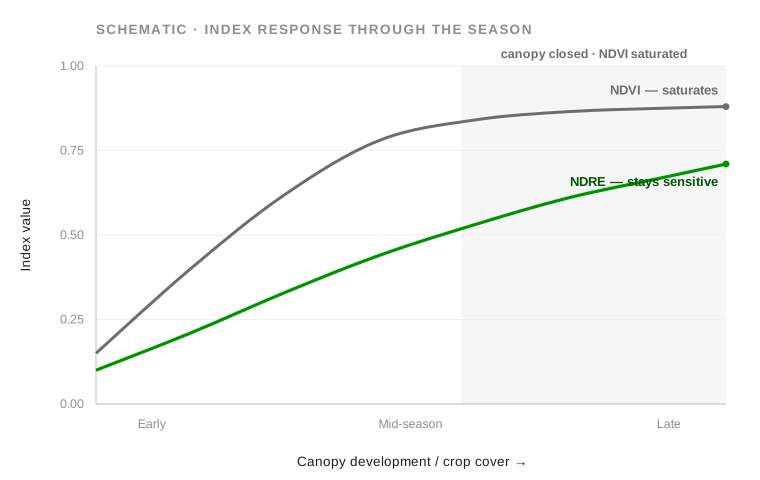
First, it saturates. Once a maize canopy closes in mid-season, NDVI flattens near its ceiling and stops separating a merely adequate crop from a thriving one — which is exactly when nitrogen demand peaks. Second, it is a blunt, late indicator of nutrient status. NDVI responds to how much green canopy there is; nitrogen deficiency first lowers the chlorophyll concentration inside leaves before it visibly thins the canopy. By the time that reaches NDVI, the plant has been short of nitrogen for some time.
The red edge — where the nutrient signal actually lives
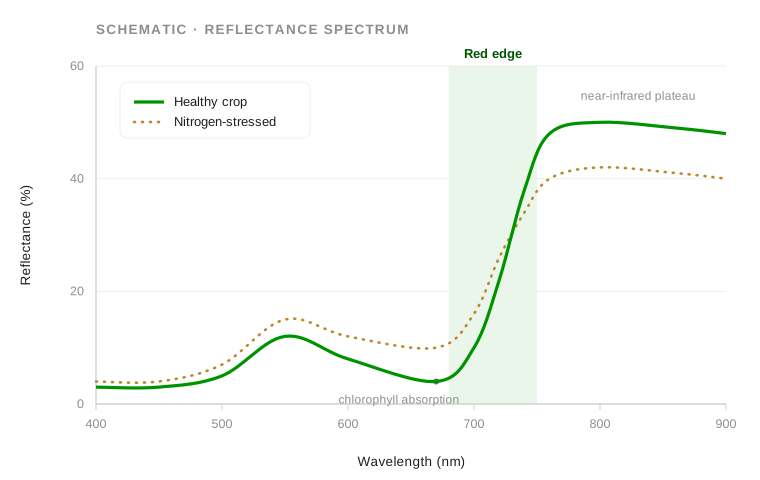
Healthy vegetation shows a steep rise in reflectance between the red (~670 nm) and the near-infrared (~780 nm). The steepest part of that climb — roughly 700–730 nm — is the red edge, and its position and slope are governed by leaf chlorophyll content. Nitrogen is a core building block of chlorophyll, so when a crop runs short of N, chlorophyll falls and the red edge shifts and flattens before the canopy browns. Indices built on a red-edge band — most commonly NDRE, (NIR − RedEdge) / (NIR + RedEdge) — read that shift. Where NDVI has saturated, NDRE is still moving, and it moves earlier.
This isn't a vendor claim; it's the thread running through my own published research. In Remote sensing of key grassland nutrients using hyperspectral techniques in KwaZulu-Natal, South Africa (Journal of Applied Remote Sensing, 2017) and Multispectral mapping of key grassland nutrients in KwaZulu-Natal, South Africa (Journal of Spatial Science, 2018), the wavelengths that best predicted foliar nutrient concentrations clustered around the red edge and the near-infrared. In forestry, Hyperspectral remote sensing for foliar nutrient detection in forestry: A near-infrared perspective (Remote Sensing Applications: Society and Environment, 2021) and Detecting nutrient deficiencies in Eucalyptus grandis trees using hyperspectral remote sensing and random forest (South African Journal of Geomatics, 2021) found the same from a different crop: nutrient deficiencies are detectable from reflectance, and the informative bands are not the ones a plain colour or NDVI view uses.
My doctoral research extended this to Eucalyptus grandis × urophylla using hyperspectral and near-infrared data, drone (UAS) and PlanetScope multispectral imagery, and machine-learning and deep-learning models. The consistent finding across all of it: the nutrient signal that shows up cleanly in a laboratory spectrum survives, in weaker but usable form, into the broad red-edge bands a satellite can see.
NDRE in practice on a Highveld farm
The practical translation for a Free State or North West grower is simple. Sentinel-2 carries three red-edge bands and revisits every few days, free; its red-edge indices come at about 20 m and its NDVI at 10 m. For finer detail and more frequent cover, PlanetScope's constellation adds a red-edge band at a few metres. Either way, the method is a time series, not a single scene — and the value, as ever, is the map, not the field average.
Maize, soybeans and sunflower
Maize is the clearest case. Its nitrogen demand climbs steeply from about V6 to tasselling — precisely the window where a closing canopy sends NDVI flat. An NDRE time series keeps resolving differences across that window, so a block or a pivot segment trending below its neighbours can be flagged for a tissue test and a side-dress decision while the response is still economic. Soybeans and sunflower, with their own canopy structures, follow the same logic: NDRE separates mid-season vigour differences that NDVI blurs. The satellite does not tell you it is nitrogen — it tells you where to look.
Citrus and macadamia in Limpopo
Orchards are a harder, honest case. Perennial tree crops develop nitrogen and micronutrient issues that red-edge indices can flag at the block level, and a multi-season NDRE record is useful for catching a declining section of an orchard early. But a 10–20 m satellite pixel mixes tree canopy with inter-row grass, bare soil and irrigation lines, so orchard work needs careful masking and is better supported by higher-resolution capture — flown by licensed partner operators for drone flights — than by Sentinel-2 alone.
The same signal, on rehabilitated mine land
The reason this sits inside a geospatial-evidence consultancy and not only an agronomy toolkit is that the method transfers directly to a question every mine rehabilitation and environmental consultant has to answer: is the revegetation actually establishing, or just greening thinly over poor ground?
Rehabilitated land is frequently nutrient-limited — stripped topsoil, low nitrogen and phosphorus — and a cover that reads as adequate in NDVI can be under real nutrient stress that red-edge indices expose. Tracking NDVI and NDRE together over several seasons, benchmarked against an adjacent undisturbed reference area under the same geology, rainfall and season, turns "it looks green" into a documented, defensible trajectory of condition — the kind of evidence a closure file actually needs. It is the same grassland- and forestry-nutrient science above, pointed at a rehabilitation footprint.
What it can't do — the honest limits
None of this is magic, and selling it as such would be a disservice. Optical satellites cannot see through cloud, and a run of Highveld thunderstorms can open gaps in a time series at the worst moment; radar (Sentinel-1) can bridge some of that, but it measures structure and moisture, not chlorophyll. Sentinel-2's resolution — 10 m for NDVI, around 20 m for the red-edge bands — will not resolve a single plant or a narrow orchard row. And an index is an indicator, not a diagnosis: NDRE can show where and when a crop is stressed, and that the pattern is consistent with a nutrient shortfall, but confirming which nutrient, and why, still needs a tissue or soil test on the ground. It is the same discipline of controls, corrections and limits that separates a defensible vegetation finding from a confident-looking one. Used honestly, the satellite layer makes the ground work sharper and cheaper by telling you exactly where to point it — it does not replace it.
A practical starting point
If you would rather see this on your own ground than in the abstract, that is the easiest thing to arrange. Send us a farm or site boundary and we will return a sample vegetation-condition map — NDVI and a red-edge index over a recent window — so you can judge the signal against what you already know about the land. It's the quickest way to tell whether the method earns its place in your season. This is the nutrient-and-condition end of our crop monitoring work; if it's useful, send a boundary.