
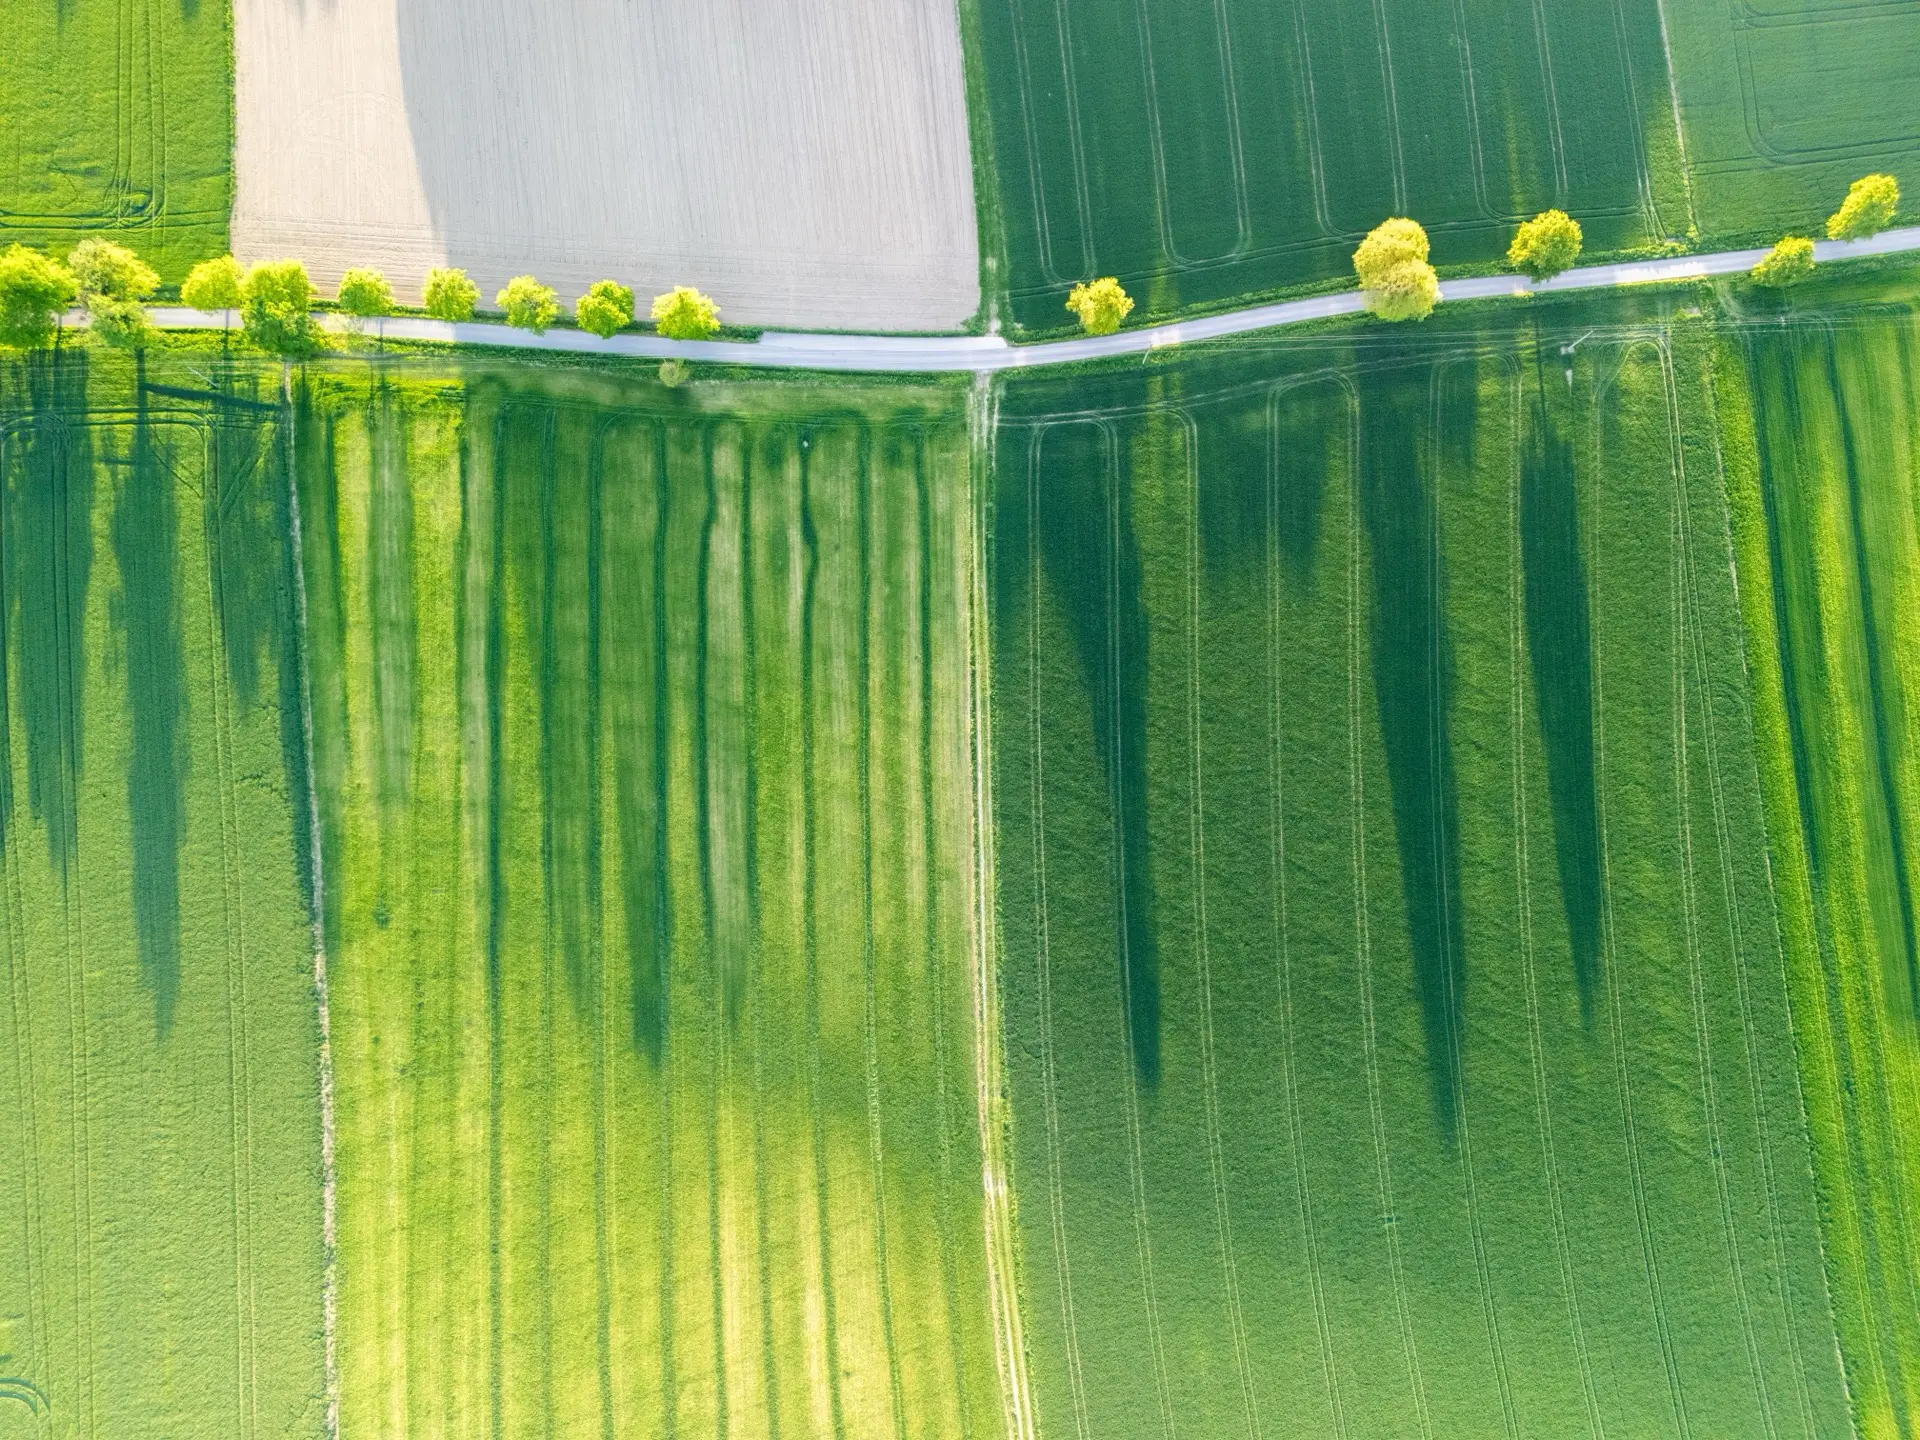
Crop monitoring
A satellite time series of crop vigour, water stress and within-field variability — the same rigorous remote sensing behind our compliance work, turned to the growing season. Objective, historical, and cheaper than walking every hectare.
What a crop time series tells you
Vegetation indices — NDVI and its relatives — track canopy vigour through the season from the same open Sentinel-2 archive that images most farmland every few days. Followed over time, they turn scattered impressions into an objective record: which fields and which pivots are performing, where a crop is establishing slowly, and how each block is trending week to week against its own history.
Within-field variability, not just an average
A single field-average number hides the thing that matters. The real value is the map: where inside a field or a centre-pivot the crop is thriving and where it is stressed. That spatial pattern is what directs ground scouting to the right spots, informs variable-rate inputs, and shows whether an intervention actually worked — measured the same way each time so the comparison holds.
Matching the index to the question
NDVI is the workhorse, but it isn't the only lens, and a serious monitoring programme chooses the index to fit the crop and the stage. NDVI saturates once a canopy closes, so at peak biomass it stops separating a good crop from an excellent one; red-edge indices, which read the sharp reflectance rise near 700 nm, stay sensitive where NDVI flatlines. Early in the season, when soil still shows between the rows, soil-adjusted indices stop the bare ground masquerading as poor vigour. Reading the right index at the right stage is the difference between a map that reflects the crop and one that reflects the sensor's blind spot.
Water and irrigation performance
Irrigation shows up clearly from above. A time series highlights pivots or segments that are underperforming, dry corners, and uneven application, while moisture-sensitive indices (using the near-infrared and red-edge bands) add a view of crop water status that a plain photograph can't. For an irrigation scheme, that's an efficiency and equity picture across the whole footprint at once.
This season, measured against every season before it
Because the archive reaches back to 2015, a field's current performance can be read against its own multi-year norm — not just against the farm next door. That turns a vigour map into an anomaly map: a block running below where it has sat at this point in previous seasons is flagged while there is still time to act, and a weak patch can be checked against whether it has always been weak (a soil constraint) or has only just appeared. The history exists whether or not anyone was monitoring at the time; it simply has to be read.
Crops, pivots and schemes this suits
Anything that forms a canopy a satellite can resolve is in scope: centre-pivot cereals and oilseeds, row crops, sugarcane and pasture, plus orchards and vineyards at the block level — with the honest caveat that tree canopy and inter-row cover mix inside a 10 metre pixel and have to be read with that in mind. The questions change with the crop — establishment uniformity, in-season stress, pre-harvest readiness, benchmarking an underperforming block against a strong one — but the method underneath each is the same consistent, corrected time series.
What you actually receive
The deliverable is built to be used, not just looked at: dated vigour and variability maps through the season, management-zone layers, and per-block time-series charts, with the underlying data supplied as GeoTIFF and shapefile so it drops straight into a GIS or a variable-rate controller. Every layer carries its method, its index definitions and its stated uncertainty — the same documentation standard as our compliance work, because a decision made on a map deserves to know how the map was made.
Where it fits alongside your other tools
Satellite monitoring doesn't replace soil sampling, yield-monitor data, drone scouting or an agronomist — it directs them. It's the cheap, whole-farm view that reads every block every few days and tells you where to point the expensive, precise tools, so scouting walks the right rows and sampling targets the right zones. The satellite layer is the backbone of the season's record; the ground work is what turns a flagged zone into a decision.
What it does and doesn't do
The layer describes condition, variability and change — not cause. It flags where and when a crop is underperforming; confirming why (nutrition, pests, water, soil) still needs an agronomist and the ground record. It is a targeting and monitoring tool that makes the ground work sharper and cheaper, not a replacement for it.
Crop monitoring — common questions
What can satellite crop monitoring show that a field average can’t?
The spatial pattern — the persistent low zones, stressed edges and wet or dry patches that a single field-average index blends away while still reading “healthy”.
Does it tell me why a zone is underperforming?
No. It shows where, not why; nutrition, pests, water and soil live in the ground record. It makes scouting and variable-rate decisions sharper and cheaper, not automatic.
What resolution and how often?
Sentinel-2 images most farmland at about 10 m every few days, splitting a pivot or field into hundreds of cells tracked through the season — provided the series is atmospherically corrected and measured the same way each time.
Which crops and fields does this work for?
Anything that forms a canopy a satellite can resolve — centre-pivot cereals and oilseeds, row crops, sugarcane and pasture, plus orchards and vineyards at block level. Orchards need care, because tree canopy and inter-row cover mix inside a 10 m pixel.
Can the output drive variable-rate application?
Yes. Management-zone and vigour layers are delivered as GeoTIFF and shapefile that load into a GIS or a variable-rate controller. The satellite layer defines the zones; your agronomy sets the rates.
Related insights
Monitoring a farm or scheme?
Tell us the crops, the area and what you need to track through the season. Reply within one working day.